|
|
Post by bubbamaximus on Feb 11, 2009 16:59:47 GMT -6
My DC has asked me and a fellow S.A. to find stats showing the
scoring percentage on drives based on number of plays. For example, if a drive is 5 plays, then the stats say that they will score X% of the time. He isn't really interested in what level, as much as something to point out to the players as somewhat of a moral boost to keep on the backburner.
I have been reading and learning from this site since a coach introduced me to this place almost a year ago, and I figured this would be the place to find the information. Google has not helped me like I had hoped, and I wanted to see if someone had looked into this also before the other SA and myself embarked on digging through game summaries and doing the math ourselves. Thank you in advance for any help you people give me!
|
|
|
|
Post by morris on Feb 11, 2009 17:24:14 GMT -6
I do not know about about ave per play scoring drive percentage but you should be able to find information of percentage of scoring in comparision to starting field position.
|
|
|
|
Post by endersgame on Feb 11, 2009 21:30:04 GMT -6
Sounds like something Chris Brown (spreadattack on the boards) would be interested in. Maybe you should contact him and see if it perks his interest.
|
|
|
|
Post by dubber on Feb 12, 2009 9:14:09 GMT -6
I too would be very interested in this, however, I imagine the statistics will come back as non relevant.
I imagine you will find as many 3 play drives ending in TD's as you do 10 play drives.......actually, I bet there are more 3 play TD drives......
|
|
|
|
Post by spreadattack on Feb 12, 2009 9:31:26 GMT -6
I saw this thread via a private message. I haven't heavily researched it but here's a couple thoughts: Whatever correlation you might have I think won't be entirely relevant or even misleading. For example, let's say the average scoring drive was about 5 plays (just making that up). So on the one hand you would say: "hey, this team doesn't score that much on 10 play drives, so their chance of scoring would be lower." The problem with this is it would be wrong, because the far more important stat is field position (and down). See the below link: www.advancednflstats.com/2008/08/expected-points.htmlIn other words, if a team is on play 4 or 5 with 1st and 10 on their own 38, the statistics (and common sense) tells us that they will score less than a team with 1st and 10 on the 15 that has run 11 plays. Well, what about a team with 1st and 10 on the 50 that has run 10 plays vs. a team that has run 2? Well, the second one probably plays in a better offense, and I leave aside the probability question whether the next play is independent or conditional on the previous one, but again I don't think that helps you much. Maybe it is just to motivate your kids, and if so, fine, but I don't think it's going to be a very helpful stat. The only thing I will say is that a team that averages more yards per play is (generally, turnovers aside) a better offense than one that averages less, and one reason is that it is very difficult to string together 10-12 plays every time to score. But, again, that is a different question than saying that the average scoring chance goes down as the number of plays in a drive goes up. Here's a couple other sort of tangentially related links: bleacherreport.com/articles/22982-another-way-to-look-at-football-offensive-efficiency-scoring-drive-percentagewww.trojanfootballanalysis.com/pc_dkla_aug282007.htmlwww.burntorangenation.com/2008/7/15/571747/beyond-the-box-score-big-p |
|
|
|
Post by jgordon1 on Feb 12, 2009 10:45:47 GMT -6
Yea, I always lie to my kids by stating if they get up to play 7 or 8 in a drive it is good because the next play will be a mistake. Now of course, it probably isn't true but the kids believe it so.. perception is reality.. I guess. Went to the stats site.. the article today theorizes that teams might be throwing TOO FEW interceptions. wow that makes you think
|
|
|
|
Post by jpdaley25 on Feb 12, 2009 13:07:31 GMT -6
How about time of possession and winning, rather than length of the drive and scoring? What do the stat guys say?
|
|
|
|
Post by dubber on Feb 12, 2009 13:13:17 GMT -6
How about time of possession and winning, rather than length of the drive and scoring? What do the stat guys say? I've posted a few times on here that I believe Time Of Possession is irrelevant as it correlates to winning. Turnovers, Red Zone Efficiency, Explosive Plays correlate to winning more highly. |
|
|
|
Post by jpdaley25 on Feb 12, 2009 14:07:02 GMT -6
I would love to see the numbers on that. Is it in an old post?
|
|
|
|
Post by bubbamaximus on Feb 13, 2009 18:52:38 GMT -6
Yea, I always lie to my kids by stating if they get up to play 7 or 8 in a drive it is good because the next play will be a mistake. Now of course, it probably isn't true but the kids believe it so.. perception is reality.. I guess. Went to the stats site.. the article today theorizes that teams might be throwing TOO FEW interceptions. wow that makes you think My DC believes and looks for the exact same thing you tell your players, but he wants actual numbers on it. I am glad some are interested in this, so the research might help more than just my guys. Thanks for all the discussion! |
|
|
|
Post by silkyice on Feb 13, 2009 19:23:48 GMT -6
I guarantee you that the scoring % goes up when you look at how many plays are in a drive.
Think about it, a 15 play drive has a much better chance than a 3 play drive at scoring.
If someone told you that you were right now about to have a 15 play drive or a 3 play drive which one would you think has the better chance to score?
Now, yes, it is more likely that something will go wrong in those 15 plays, but if did, it more than likely would have happened during plays 1-14 and therefore you never would have gotten to play 15.
Man, I don't know if any of that makes sense. I have a cold, and I just woke up from a nap.
All in all, I believe that it would be a misleading stat.
But, I bet there are more points scored off of 3 play drives because there are a ton of 3 play drives and very few 15 play drives.
And, yes, I do know that you usually need big plays in a drive to score and that there is a greater likelihood that something will go wrong on long drives.
|
|
|
|
Post by coachd5085 on Feb 14, 2009 7:17:53 GMT -6
This will be the prime example of being able to use numbers and statistics to justify anything.
Remember, there is a correlation IS NOT causation. There is a VERY HIGH correlation between ice cream sales figures and crime rates. VERY HIGH. Obviously, buying ice cream does not lead to crime waves.
|
|
|
|
Post by justryn2 on Feb 14, 2009 8:35:22 GMT -6
Wouldn't the most important stat be average yards per offensive play? The number plays in a drive will only have a meaningful correlation to scoring when you factor in the starting field position. And then it could be expressed in terms average yards per play.
|
|
|
|
Post by Coach Huey on Feb 14, 2009 16:08:19 GMT -6
looking for "meaningful" stats to determine success rate?
1) points allowed
2) points scored
lol
|
|
|
|
Post by gdoggwr on Feb 14, 2009 17:24:52 GMT -6
looking for "meaningful" stats to determine success rate? 1) points allowed 2) points scored lol Thats the best advice I've heard in a long time. ;D I'm still laughing. |
|
|
|
Post by artoftroy on Feb 15, 2009 14:57:09 GMT -6
My DC has asked me and a fellow S.A. to find stats showing the scoring percentage on drives based on number of plays. For example, if a drive is 5 plays, then the stats say that they will score X% of the time. He isn't really interested in what level, as much as something to point out to the players as somewhat of a moral boost to keep on the backburner. Okay coach. I'll bite...here are some numbers for one NCAA Division I program with 165 drives on offense during the 2008 season. It may or may not be representative of other teams and other levels, etc. This team scored 37 points per game and did pretty well...it would be better to duplicate this for your own opponents. 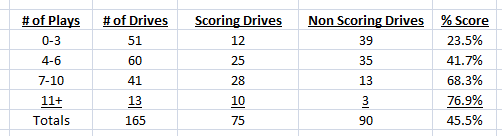 I put the data into groups (0-3 plays, 4-6 plays, etc.) for ease of observation. In *general* the longer a team has the ball the more likely they are to score...but exceptions of course exist. So of course it is great as noted above to hold a team to 3 and out as much as possible. The "how" of course is hard and why the defensive guys earn their pay. ;D Raw data in histogram form: 1. Avg. length of drive in terms of plays (all drives) 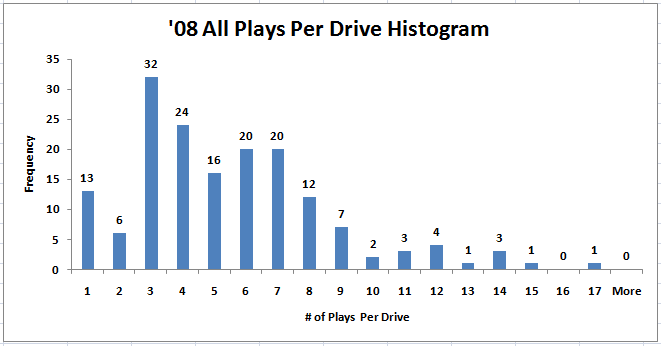 2. Avg. length of drive in terms of plays (scoring drives) 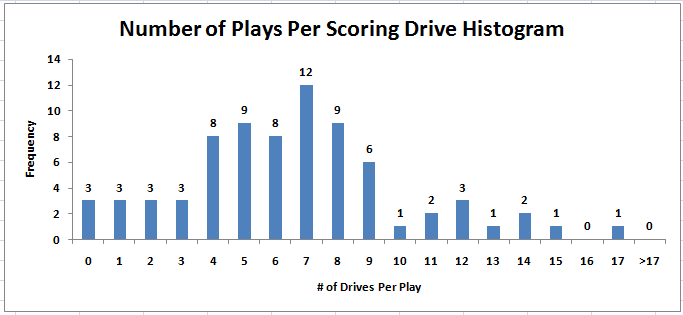 3. Avg. length of drive in terms of plays (non-scoring drives) 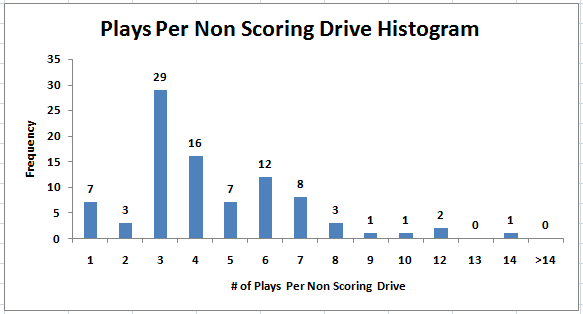 Note 1: This team had 3 zero play scoring drives (e.g. defense and special teams scored). You might want them out for your DC's original question. Note 2: You can import data off your drive charts into Excel of this sort of check using the Import Data from Web, Text, or Other Source function if you familiar with basic data manipulation. |
|
|
|
Post by spreadattack on Feb 15, 2009 16:38:26 GMT -6
Great post, and great contribution. Not sure what help "score more points than your opponent" is supposed to help with. Maybe the lesson is fancy stats come after good teaching, but duh. Maybe it is that thinking about and discussing statistics beyond points scored and allowed is unhelpful. If so, I completely disagree. Keep in mind I am not interested in fan stats, but relationships between numbers, causes, events, and area of focus. We still all have a lot to learn about this great game.
|
|
|
|
Post by bubbamaximus on Feb 16, 2009 19:33:20 GMT -6
Thanks for all the help!
|
|